Phase Diagrams
From DT Online
Phase Diagrams are charts which show how different Phases can exist together under certain conditions (e.g. the temperature range at which water and ice can exist together in slushy conditions). Three obvious Phases are the three states of matter: Solid, Liquid, and Gas but different Phases also exist when two or more liquids or solids come into contact with each other and form distinctive Crystalline Structures for example.
In Metallurgy we are normally concerned with just Solid and Liquid phases plus situations where these might exist together. The temperature line above which everything is Liquid is known as the Liquidus and the line below which everything is Solid is known as the Solidus.
Note: DT Online makes no attempt to explore the full depths of the fascinating topic of Metallurgy but hopes that the brief introduction given will stimulate interest and lead to further study. See the full series of lectures on YouTube (‘A’ Level Chemistry and beyond).
Cooling Curves

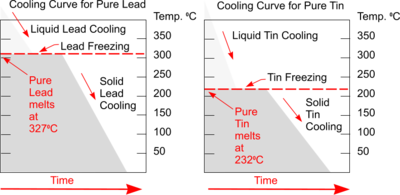
Plotting a graph of Temperature and Time as liquid metal cools will produce a Cooling Curve. Such graphs serve to illustrate the behaviour of metal as it cools and what changes occur at different temperatures.
Typical Cooling Curves for pure metals will be a stepped graph as shown. Heat is being lost throughout the process but at the point of freezing the temperature doesn't fall because the freezing process will liberate heat at exactly the same rate that it is being lost to the surroundings.
This is the result of energy being released when new atomic bonds are formed formed (e.g changing states from Liquid to Solid Lead or Tin).

The Cooling Curve for an Alloy is more complicated and reveals interesting behaviours as solidification takes place.
With this particular Alloy, nothing happens at the normal freezing point of Lead because the addition of Tin has lowered this. Some solidification of Lead starts around 2500C but Tin remains liquid and there is not enough energy released to cause the Cooling Curve to go horizontal - although it does flatten out because cooling slows down a little.
The temperature stops falling at 1830C when both the Tin and Lead are starting to freeze. Once everything has solidified, the temperature continues to fall.
Phase Diagram for Lead/Tin Eutectic Alloy

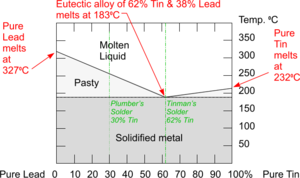
Phase Diagrams combine the information from the Cooling Curves of mixtures of metals with metals and with other elements to create a chart which is used to show the behaviours of different Alloy compositions as they change phases between Solid to Liquid states.
The Phase Diagram for the Eutectic Alloy of 62% Tin & 38% Lead shows that at 1830C it changes from : Liquid to Solid without going through any ‘pasty’ stage which makes it ideal for Tinman's Solder.

Phase Diagram for Carbon Steel
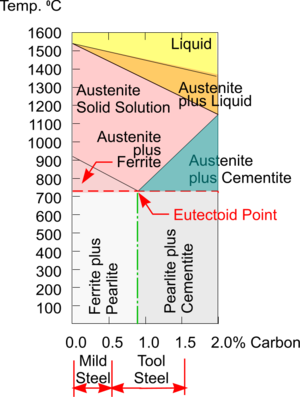
As Carbon Steels are heated towards their melting point their Crystalline Structures change from a Body Centred Cubic structure to a Face Centred Cubic structure. A consequence of this is that Iron heated above this Critical Point can absorb a lot more Carbon within a FCC structure.
Ferrite can be taken as just another name for Iron and, at room temperatures, it can absorb only a very small amount of Carbon (i.e. about 0.006%) within its single phase BCC structure.
But immediately above 723°C Iron changes to a different single phase FCC structure called Austenite and now can absorb up to about 0.8% carbon - and this increases with rising temperature. Austenite can only exist at this elevated temperature and so as it cools all the extra Carbon has to go somewhere.
Note: For simplicity the small areas of single phase Ferrite on the left of the diagram and single phase Carbon on the right have been omitted.
The Phase Diagram shows that for Steels with less than about 0.8% Carbon (i.e. Hypo Eutectic Steel) the mix solidifies into a two phase structure containing Ferrite which is very Soft and Ductile, and a layered structure of both Ferrite and Cementite (aka Iron Carbide) which is very Hard and Brittle - really a Ceramic. This layered structure is called Pearlite because of its appearance.
If cooled slowly, the Steel is stronger because of the added Cementite but still quite workable because large grains are given time to form and create space for Dislocations to move. The more Cementite the harder the metal, the more Ferrite, the softer it will be.
Steel with about 0.8% Carbon is known as Eutectoid Steel and at this concentration of Carbon, the grain structure is completely Pearlite. In Steel with more than about 0.8% of Carbon (i.e. Hyper Eutectoid Steel) there is too much Carbon to just form Pearlite and a mixture of Pearlite with additional Cementite precipitating out at the grain boundaries is formed.
If Austenite is Quenched there is no time for the Carbon to precipitate out and form Cementite, so the extra remains trapped in a deformed BCC structure called Martensite which is very Hard and Brittle indeed such that the Quenched steel can break like a stick of chalk. The more Carbon (e.g. up to about 2%) which is present then the more Martensite is formed.